Fire Spread
A fire-spread simulation is a forecast. See Fire Spread for simulation inputs, response fields, and output definitions.
A simulation result has four map output products. Show one output for a simulation at a time.
Fire breaks
A fire break is a polygon or multipolygon that defines a non-burnable area for the simulation.
Colour
Use a white rgba(255, 255, 255, 0.1) fill at 10% alpha and a 2 px orange rgb(255, 71, 36) outline with a 4 px dash
and an 8 px gap. Draw fire breaks above fire-spread outputs.
Legend and labels
Identify fire breaks with the dashed orange rgb(255, 71, 36) line in the legend.
Interaction behaviour
Use a white rgba(255, 255, 255, 0.4) fill at 40% alpha and a 2 px cyan #04CECF outline for a selected fire break.
Output products
A simulation result has four map output products. Show one output for a simulation at a time.
Affected area
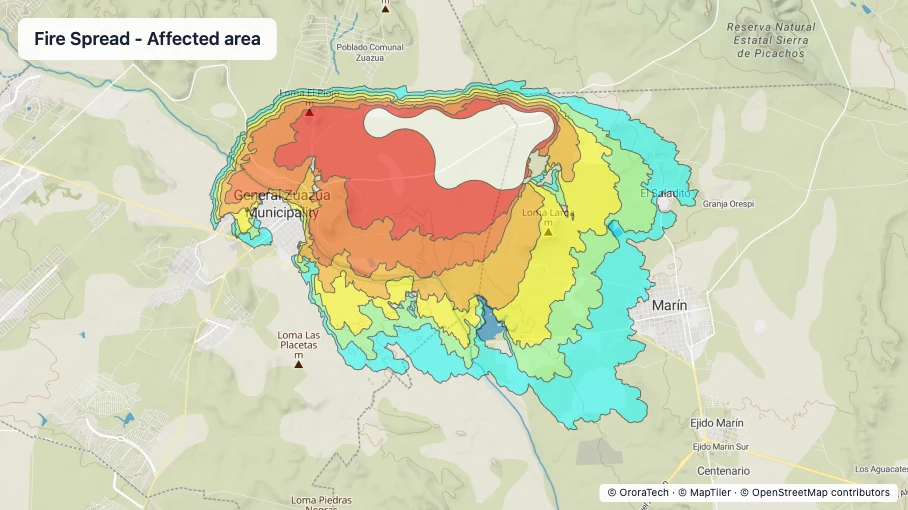
The affected-area output shows the forecast extent at each simulation step.
Colour
Use a solid fill, a 1 px black #000000 outline, and the WFS jet ramp. Normalise the ramp to the
number of steps. Use 50% layer opacity.
Time series
The selected forecast step controls how many affected-area polygons are visible. Draw the nested polygons from the largest to the smallest. Draw earlier forecast steps above later steps.
Legend and labels
Label every step by forecast time. Do not use colour as the only indication of forecast time.
Zoom behaviour
Affected area has no product-specific zoom threshold.
Interaction behaviour
Affected-area polygons have no click interaction.
Raster outputs
Fireline intensity, flame length, and rate of spread are raster outputs.
Colour
Render zero, out-of-range, and no-data raster values as transparent.
Time series
Raster outputs do not step through the affected-area forecast times.
Legend and labels
Show every class and unit in the raster legend.
Zoom behaviour
Raster outputs have no product-specific zoom threshold.
Interaction behaviour
Show the value under the pointer for a raster output.
Metadata
The fire-spread detail panel presents metadata used to interpret a simulation and its selected output.
- Weather model — the model used by the simulation, used to identify the forecast source.
- Forecast weather — the weather inputs used by the simulation, used to understand the forecast conditions.
- Forecast step — the selected point in the simulation timeline, used to place the affected area in time.
- Affected area — the forecast area at the selected step, used to understand the predicted extent.
- Raster value — the value under the pointer, used to inspect a raster output at a location.
- Class and unit — the meaning and measurement unit of the raster value, used to interpret it correctly.
Fireline intensity
The fireline-intensity output uses classes measured in kilowatts per metre.
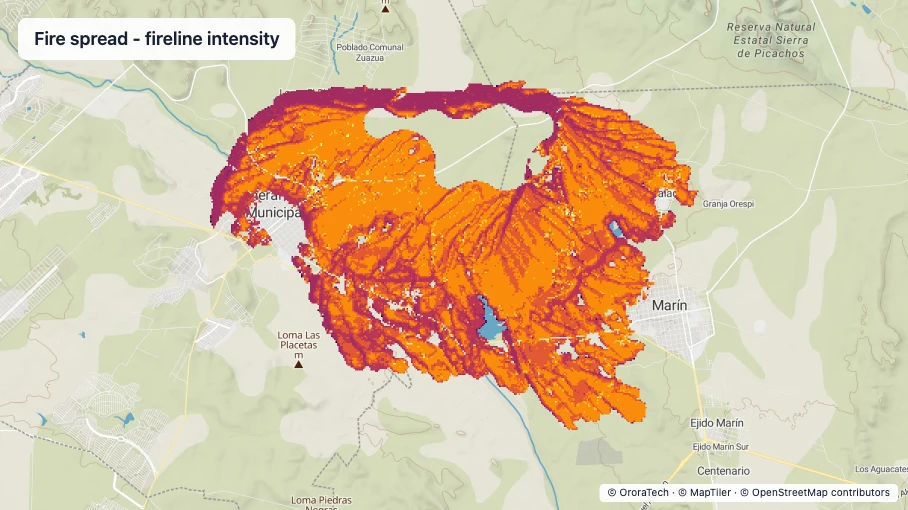
Use the WFS inferno ramp and these classes.
| Class | Range in kW/m | Colour |
|---|---|---|
| I− | 0–3.162 | #000004 |
| I+ | 3.162–10 | #1F0C48 |
| II− | 10–31.62 | #550F6D |
| II+ | 31.62–100 | #88226A |
| III− | 100–316.2 | #A12C60 |
| III+ | 316.2–1000 | #BA3655 |
| IV− | 1000–3162 | #E35933 |
| IV+ | 3162–10000 | #F98C0A |
| V− | 10000–31620 | #F9C932 |
| V+ | 31620 and above | #FCFFA4 |
Flame length
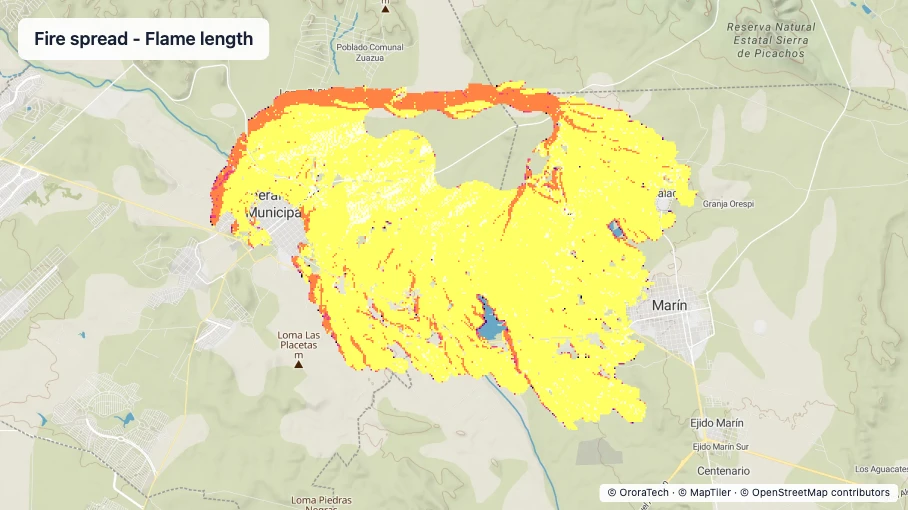
The flame-length output uses classes measured in metres.
| Class | Range in m | Colour |
|---|---|---|
| Very low | 0–0.6 | #010005 |
| Low | 0.6–1.2 | #520D8E |
| Medium | 1.2–1.8 | #BC2E9A |
| High | 1.8–2.4 | #F04188 |
| Very high | 2.4–3.7 | #FF8345 |
| Extreme | 3.7–15 | #FFFF64 |
| Critical | 15 and above | #FFFFEB |
Rate of spread
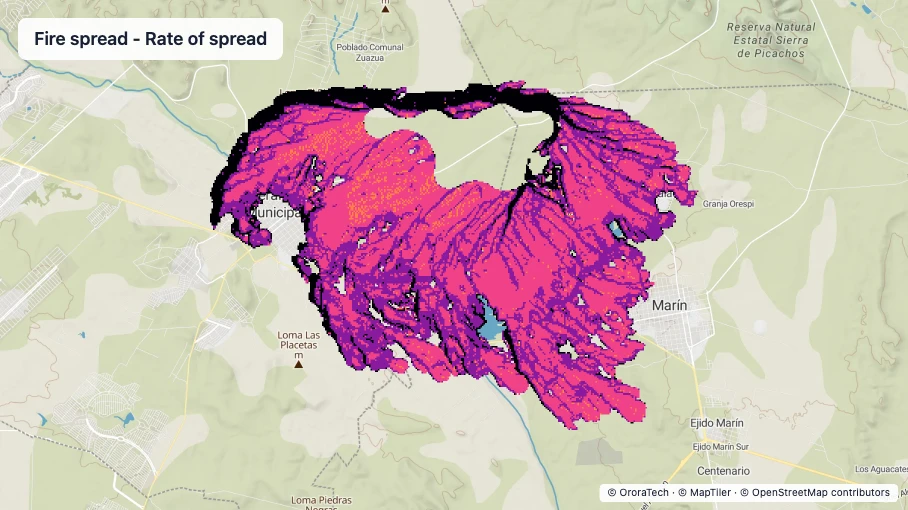
The rate-of-spread output uses classes measured in metres per minute.
| Class | Range in m/min | Colour |
|---|---|---|
| Low | 0–1.68 | #010005 |
| Medium | 1.68–10.2 | #881B9E |
| High | 10.2–33.6 | #F04188 |
| Very high | 33.6–83.4 | #FF8345 |
| Extreme | 83.4 and above | #FFFF64 |