Fire Detections
WFS presents fire detections as Hotspots, Markers, or Fire Grid. Show one representation at a time. See Hotspots for hotspot fields, GSD, and API use, and Fire Grid for grid endpoints and response fields.
Shared behaviour
Shared behaviour keeps the three detection representations consistent.
Time series
The visible time window determines which detections are shown and normalises their recency colours.
Legend and labels
Show the start and end of the visible time window in the recency legend.
Zoom behaviour
Show Hotspots and Markers at zoom 10 and above. Show Fire Grid at zoom 8 and above.
Hotspots
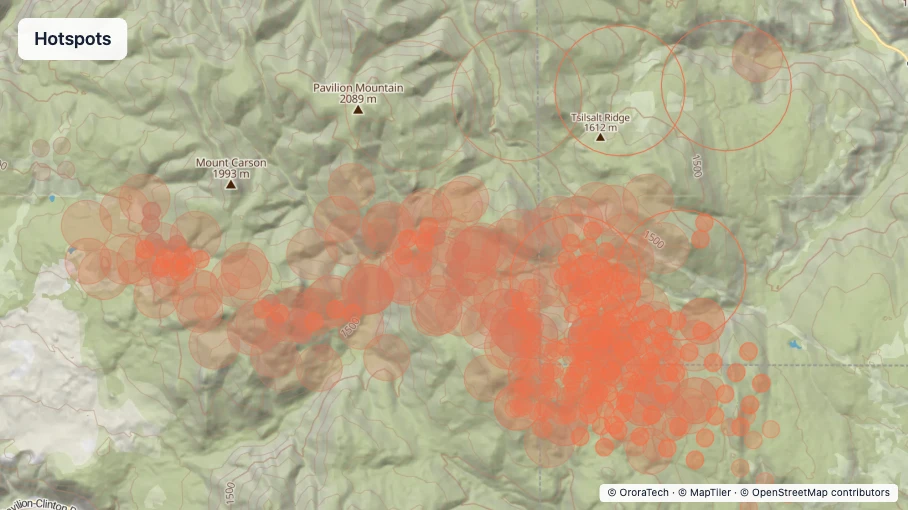
Hotspots show individual thermal anomalies as circles that represent their source pixels.
Colour
Set each hotspot diameter to the ground sampling distance (GSD) of its source pixel.
Use a linear recency ramp from orange rgb(245, 110, 69) for the newest value to grey
rgb(140, 140, 140) for the oldest value.
| Orbit | Fill | Outline |
|---|---|---|
| LEO | Recency colour at 25% alpha | Recency colour at 50% alpha, 1 px |
| GEO | None | Recency colour at 50% alpha, 1 px |
Interaction behaviour
Use a 3 px cyan #04CECF outline and retain the recency fill for a selected hotspot. On click, WFS
opens the associated hotspot detail panel.
Markers
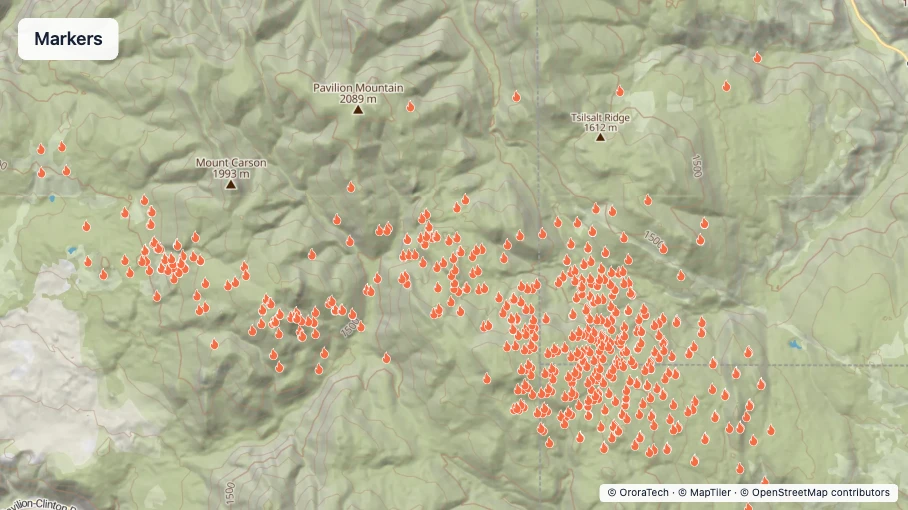
Markers show individual hotspots as symbols instead of source-pixel circles.
Colour
Draw each marker as an ot-fire glyph. Use the hotspot recency ramp for the glyph colour.
Interaction behaviour
Use cyan #04CECF instead of the recency colour for a selected marker. On click, WFS opens the
associated hotspot detail panel.
Fire Grid
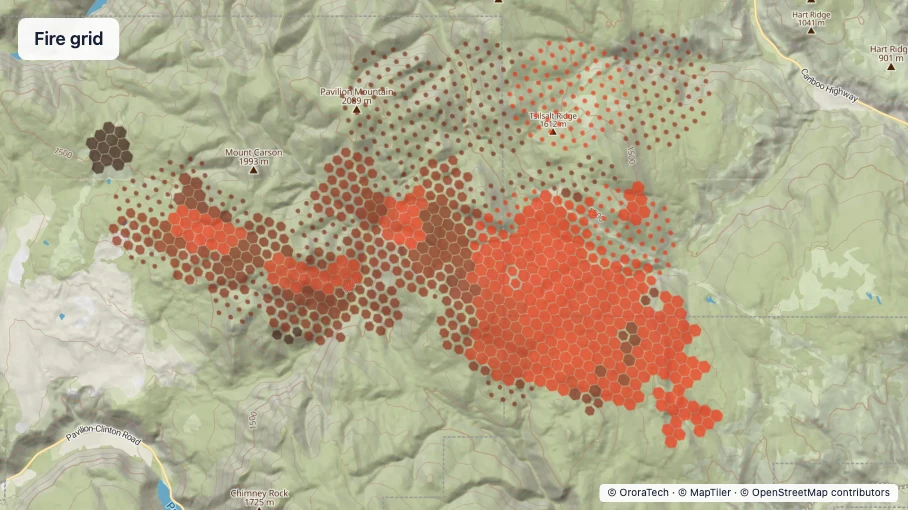
Fire Grid aggregates hotspots into H3 cells.
Colour
Use the WFS recency ramp from near-black rgb(20, 16, 14) for the oldest value to bright
red-orange rgb(255, 50, 20) for the newest value. Use 95% alpha for the cell style and
70% opacity for the layer.
Certainty scaling is on by default. Scale each cell around its centre with the API
scale_factor. The scale range is
0.25 to 0.95. When certainty scaling is off, draw
the complete cell.
Time series
Colour each cell from its latest acquisition time.
Legend and labels
Show whether certainty scaling is active.
Zoom behaviour
The API does not infer H3 resolution from map zoom. Use these WFS aggregation settings.
| Zoom | H3 resolution | Shape mode |
|---|---|---|
| 8–9 | 7 | Point |
| 10 | 8 | Point |
| 11 and above | 9 | Shape |
Interaction behaviour
On hover, outline the complete unscaled cell in cyan #04CECF at 2 px. On click, WFS opens the
associated cluster detail panel.
Hotspots and markers
Hotspots and markers present the same metadata because both represent an individual detection. See Hotspot details for the API response.
- Acquisition time — when the satellite collected the source data, used to understand when the observation was made.
- Detection time — when WFS recorded the hotspot, used to understand when it became available.
- Location — the position of the detection, used to locate it on the ground.
- Satellite — the satellite that produced the observation, used to identify its source.
- Age — the elapsed time since detection, used to understand its recency.
- Normalised FRP — the hotspot's normalised fire radiative power, used to compare its measured intensity.
- Hotspot confidence — the confidence assigned to the detection, shown where available to support assessment.
Fire Grid
WFS presents the following metadata in a summary card shown when hovering over a cell. See Interpreting a cell for the underlying response fields.
- Hotspot count — the number of detections in the cell, used to understand the size of the aggregation.
- Maximum FRP — the highest fire radiative power in the cell, used to identify its strongest measured detection.
- Latest detection time — the newest detection in the cell, used to understand its recency.
- Contributing satellites — the satellites that produced the detections, used to identify the data sources.
- Associated cluster IDs — the clusters linked to the cell, used to connect the aggregation to cluster details.