Fire Spread
The Fire Spread APIs can be used to get a prediction how a certain fire cluster will spread over time. The prediction uses the industry-approved Rothermel model, a mathematical model developed by Richard C. Rothermel to estimate fire spread and intensity based on fuel, weather, and topography.
Every endpoint returns a GeoJSON FeatureCollection which consists of the initial fire front as well as the predicted fire fronts.
Fire Spread predictions for clusters
To retrieve information how a cluster's perimeter will develop over time you can use the GET /v1/clusters/:id/fire_spread/ endpoint.
Parameters
:idthe ID of the cluster the simulation should be run fordatedefines the point in time from which the prediction should be started. This also informs the shape of the fire front which is taken into consideration for initiation of the simulation. If this parameter is omitted the time of the cluster's latest hotspot acquisition is used by default.stepsspecify the number of simulation intervals into the future for which the fire spread will be calculated. The duration of each interval is determined by thestep_sizeparameter. For instance, ifsteps=6andstep_size=30(representing 30 minutes), the simulation will predict the fire spread over a total duration of three hours, generating six predicted fire perimeters at 30-minute intervals.step_sizespecifies the duration of each simulation step in minutes.- The
use_wind_ninjaparameter allows users to enable a microscale wind modeling tool, developed by the US Forest Service. When set totrue, the WindNinja software is used to compute a high resolution wind field by downscaling weather forecast data. The grid resolution is adjusted based on the complexity of the terrain, with steeper slopes receiving higher resolution and flatter areas lower resolution. This can enhance the accuracy of fire spread predictions, though it may result in longer processing times. - With the
weather_modelparameter users can select from a list of different weather models to retreive their wind data. By default,Best matchis selected which automatically chooses the most suitable weather model based on availability and resolution. If a weather model is selected that doesn't cover the requested locationBest matchwill be used as fallback. See Weather Models for more information. - The optional
fuel_moisture_percentageparameter is the amount of water in the fuel expressed in percentage. It is computed from the weight of contained water divided by the oven-dry weight of the fuel. Fuel-moisture values in the flammability range extend from about 1.5 to 30 percent for dead fuels. - When passing the
wind_speedparameter, it is required to also pass thewind_directionparameter. By combining these two, it is possible to force a specific wind vector for every step of the simulation. This can be useful to simulate the fire spread with ad-hoc data or under different wind conditions. Both parameters are arrays and expect a decimal value for each step of the simulation. For example for a simulation withsteps=6, the parameters must contain 6 values:wind_speed=5,5,7.83,7,2,2(values must always be positive)wind_direction=90,90,105,110,50,50(values are in degrees between 0 and 360)
- With the optional
wind_speed_unitsparameter it is possible to specify a unit for the wind speed values. The default value ism/s. Valid values are:m/s(meters per second)km/h(kilometers per hour)mph(miles per hour)knots(knots)
- The
fire_breakparameter expects a GeoJSON file which represents a Polygon or MultiPolygon geometry to be used as a non-burnable region. The given fire break will be used to stop the fire spread in the simulation.
Example
https://app.ororatech.com/v1/clusters/57618553/fire_spread/?epsg=4326&steps=6&wind_speed=5,5,7.83,7,2,2&wind_direction=90,90,105,110,50,50
The request above will return the predicted fire perimeter for the cluster with the ID 57618553 for the next 6 hours. It will use the wind speed (in m/s) and direction values provided in the parameters for the simulation.
The response will be in the WGS 84 coordinate reference system and the wind data will be taken from the default weather model.
Fire Spread predictions for arbitrary geometries
To retrieve information for an arbitrary perimeter will develop over time you can use the POST /v1/fire_spread/polygon_file/ endpoint. This endpoint expects a point or polygon as input data and calculates possible fire spread for this shape. Points will be buffered by 40m prior to the calculation.
Parameters
- The
simulation_polygonparameter expects a GeoJSON file which represents a Point, Polygon or MultiPolygon geometry to be used as an initial point or perimeter for the Fire Spread prediction. datedefines the point in time from which the prediction should be started. This also informs the shape of the fire front which is taken into consideration for initiation of the simulation. If this parameter is omitted the time of the cluster's latest hotspot acquisition is used by default.stepsspecify the number of simulation intervals into the future for which the fire spread will be calculated. The duration of each interval is determined by thestep_sizeparameter. For instance, ifsteps=6andstep_size=30(representing 30 minutes), the simulation will predict the fire spread over a total duration of three hours, generating six predicted fire perimeters at 30-minute intervals.step_sizespecifies the duration of each simulation step in minutes.- The
use_wind_ninjaparameter allows users to enable a microscale wind modeling tool, developed by the US Forest Service. When set totrue, the WindNinja software is used to compute a high resolution wind field by downscaling weather forecast data. The grid resolution is adjusted based on the complexity of the terrain, with steeper slopes receiving higher resolution and flatter areas lower resolution. This can enhance the accuracy of fire spread predictions, though it may result in longer processing times. - With the
weather_modelparameter users can select from a list of different weather models to retreive their wind data. By default,Best matchis selected which automatically chooses the most suitable weather model based on availability and resolution. If a weather model is selected that doesn't cover the requested locationBest matchwill be used as fallback. See Weather Models for more information. - The optional
fuel_moisture_percentageparameter is the amount of water in the fuel expressed in percentage. It is computed from the weight of contained water divided by the oven-dry weight of the fuel. Fuel-moisture values in the flammability range extend from about 1.5 to 30 percent for dead fuels. - When passing the
wind_speedparameter, it is required to also pass thewind_directionparameter. By combining these two, it is possible to force a specific wind vector for every step of the simulation. This can be useful to simulate the fire spread with ad-hoc data or under different wind conditions. Both parameters are arrays and expect a decimal value for each step of the simulation. For example for a simulation withsteps=6, the parameters must contain 6 values:wind_speed=5,5,7.83,7,2,2(values must always be positive)wind_direction=90,90,105,110,50,50(values are in degrees between 0 and 360)
- With the optional
wind_speed_unitsparameter it is possible to specify a unit for the wind speed values. The default value ism/s. Valid values are:m/s(meters per second)km/h(kilometers per hour)mph(miles per hour)knots(knots)
- The
fire_breakparameter expects a GeoJSON file which represents a Polygon or MultiPolygon geometry to be used as a non-burnable region. The given fire break will be used to stop the fire spread in the simulation. - If a fire break was given, the
fuel_reductionparameter can be used to tune the fuel load reduction in the fire break. The default,1, effectively sets the area unburnable, whereas0leaves the fuel unaffected. custom_fuel_map(string) A custom fuel map provided to the model. A path to a TIFF file, either starting with 's3' and stored on a remote server, or stored locally. A fuel table must be provided with this option.custom_fuel_table(string) A local or s3 path to csv describing the physical characteristics of each fuel in the used fuel map, as needed by the ForeFire fire propagation model. This may be used without a custom fuel map, provided it has entries for each index in the fuel map used by the simulation.
Weather Models
| Weather Model | Provider | Region | Spatial Resolution | Temporal Resolution | Update Frequency |
|---|---|---|---|---|---|
| DWD Icon Global | DWD Germany | Global | 0.1° (~11 km) | Hourly | Every 6 hours |
| DWD Icon EU | DWD Germany | Europe | 0.0625° (~7 km) | Hourly | Every 3 hours |
| DWD Icon D2 | DWD Germany | Central Europe | 0.02° (~2 km) | Hourly | Every 3 hours |
| GFS Global | NOAA | Global | 0.11° (~13km) | Hourly | Every 6 hours |
| GFS HRRR | NOAA | U.S. Conus | 3km | Hourly | Every hour |
| MeteoFrance Arpege World | MeteoFrance | Global | 0.25° (~25km) | Hourly | Every 6 hours |
| MeteoFrance Arpege Europe | MeteoFrance | Europe | 0.1° (~11km) | Hourly | Every 6 hours |
| MeteoFrance Arpege France | MeteoFrance | France | 0.025° (~2.5km) | Hourly | Every 3 hours |
| MeteoFrance Arpege France HD | MeteoFrance | France | 0.01° (~1.5km) | Hourly | Every 3 hours |
| ECMWF AIFS 0.25° | ECMWF | Global | 0.25° (~25km) | 6-Hourly | Every 6 hours |
| ECMWF IFS 0.25° | ECMWF | Global | 0.25° (~25km) | 3-Hourly | Every 6 hours |
| GEM Global | GEM Canada | Global | 0.15° (~15km) | 3-Hourly | Every 12 hours |
| GEM GDPS | GEM Canada | Global | 0.15° (~15km) | 3-Hourly | Every 12 hours |
| BOM Access Global | BOM Australia | Global | 0.15° (~15km) | Hourly | Every 6 hours |
Result
Fire perimeter
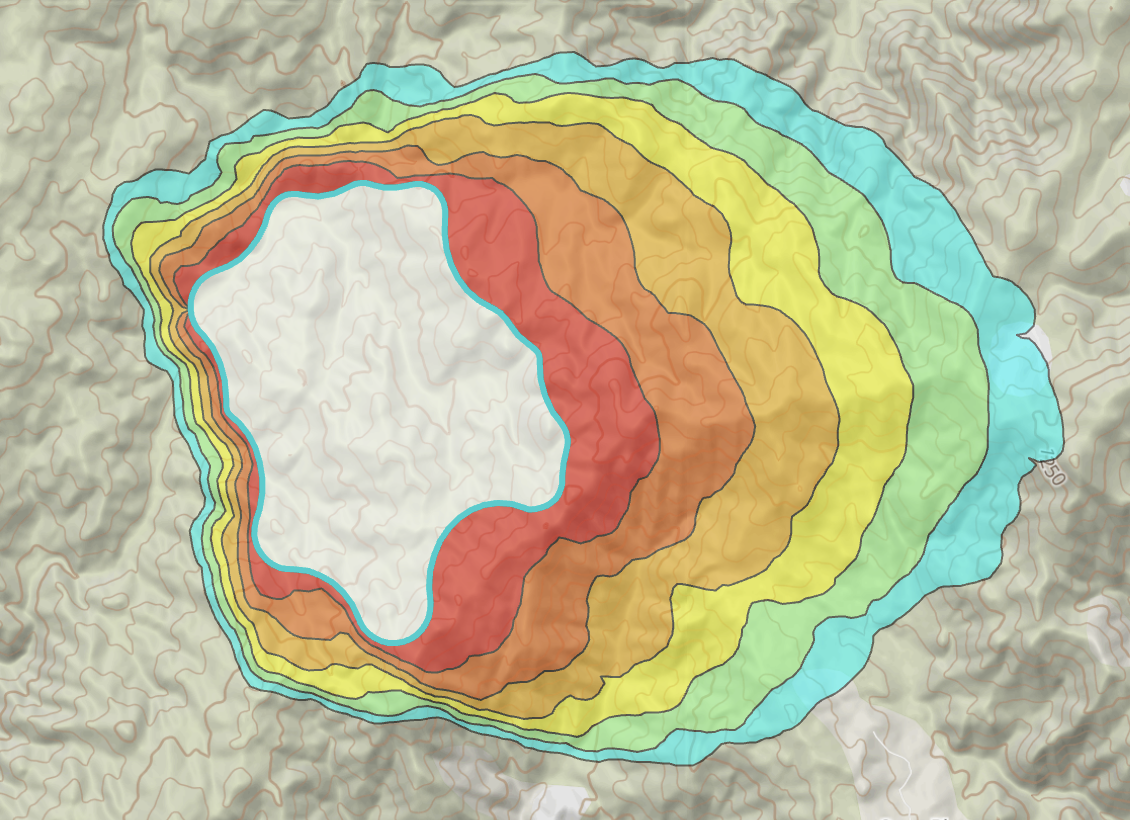
In both cases the endpoints return a GeoJSON FeatureCollection, where the first Feature is the initial fire front (the cluster shape at date or the geometry of the input file for arbitrary geometries) and the subsequent Features represent the predicted fire perimeter in hourly intervals.
The file contains the following attributes:
| Attribute | Description |
|---|---|
| type | It is used to define the structure and semantics of the GeoJSON data. |
| features | List of features, described here. |
| fuel_map_provider | The name of the fuel map used for the simulation. |
| fuel_map_file | Link to a crop of the fuel map used for the simulation. (raster) |
| elevation_file | Link to a crop of the elevation file used for the simulation. (raster) |
| fuel_type_distribution | Link to predicted affected area per step (json). |
| weather_model | Weather model used to request imput parameters for the simulation. |
| bfi_path | Path to Byram Fireline Intensity (raster, categorized) |
| flame_length_path | Path to Flame Length product (raster, categorized) |
| ros_path | Path to Rate of Spread Product (continuous raster, m/min) |
| cluster_id | ID of the cluster used as initial fire perimeter, if exists. Defaults to 0. |
| fire_break | Fire break coordinates used as input, if exists. Otherwise null. (MultiPolygon) |
| task_id | Unique identifier |
| version | Fire Spread Simulator version |
Each Feature has the following properties:
| Properties | Description |
|---|---|
| area_sqkm | Shows the predicted fire perimeter area (in square kilometers) for the step. |
| date | Represents the time for which this step is calculated. |
| fuel_moisture_percentage | Fuel moisture per step (default: top 2cm soil moisture as proxy) |
| info | Execution status |
| rate_of_spread | Predicted Head Rate of Spread (HROS) value, m/min |
| rate_of_spread_unit | Selected rate of spread unit |
| wind_direction | Predicted wind direction value |
| wind_speed | Predicted wind speed value |
| name | Step name, used for GeoJSON styling |
| fill | Fill color, used for GeoJSON styling |
| fill-opacity | Fill opacity, used for GeoJSON styling |
| stroke | Border color, used for GeoJSON styling |
| stroke-width | Border width, used for GeoJSON styling |
{
  "type":"FeatureCollection",
  "features": [
    {
      "type":"Feature",
      "geometry" : {
        "type":"MultiPolygon",
        "coordinates" : [

        ]
      },
      "properties" : {
        "area_sqkm":36.30873,
        "date":"2026-05-04T04:08:05Z",
        "fuel_moisture_percentage":19,
        "info":"{\"code\":2000}",
        "rate_of_spread":3.5958391610649763,
        "rate_of_spread_unit":"m/min",
        "wind_direction":327,
        "wind_speed":2.9681644439697266,
        "wind_speed_unit":"m/s",
        "name":"Step 6",
        "fill":"#fff",
        "fill-opacity":0,
        "stroke":"#05ffff",
        "stroke-width":2},
    },
    {
      "type":"Feature",
      "geometry" : {
        "type":"MultiPolygon",
        "coordinates": [

        ]
        },
      "properties" : {
        "area_sqkm":21.9373,
        "date":"2026-05-04T00:08:05Z",
        "fuel_moisture_percentage":19,
        "info":"{\"code\":2000}",
        "rate_of_spread":9.0429573346448,
        "rate_of_spread_unit":"m/min",
        "wind_direction":300,
        "wind_speed":6.003332138061523,
        "wind_speed_unit":"m/s",
        "name":"Step 2",
        "fill":"#fff",
        "fill-opacity":0,
        "stroke":"#fc5500",
        "stroke-width":2
        },
    }
  ],
  "fuel_map_provider":"landcover-esa-2021",
  "fuel_map_file":"https://storage.ororatech.com/{bucket}/{task_id_fe}_fuel_map_file.tif",
  "fuel_type_distribution":"https://storage.ororatech.com/{bucket}/{task_id_fe}_fuel_type_distribution.json",
  "flame_length_path":"https://storage.ororatech.com/{bucket}/{task_id_fe}_flame_length_path.tif",
  "bfi_path":"https://storage.ororatech.com/{bucket}/{task_id_fe}_bfi_path.tif",
  "ros_path":"https://storage.ororatech.com/{bucket}/{task_id_fe}_ros_path.tif",
  "elevation_file":"https://storage.ororatech.com/fire-spread-udata/{bucket}/{task_id_fe}_elevation_file.tif",
  "task_id":"20153bbb-b72e-4960-9510-d4f1da5ba660",
  "cluster_id":100991875,
  "weather_model":"best_match",
  "fire_break":null,
  "version":"v2.15.0",
}
Affected area
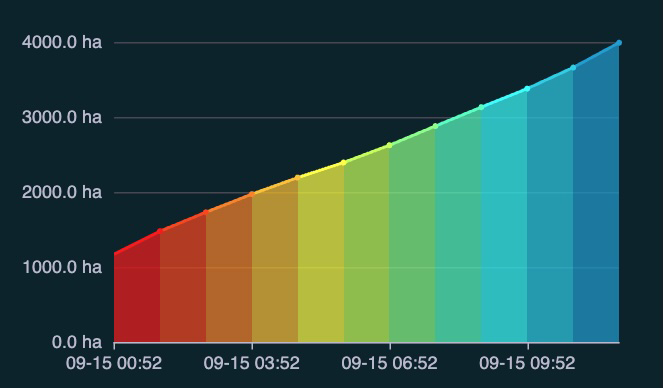
This product displays a column graph illustrating the affected area for each simulation step, providing a clear visual representation of how the fire spreads over time.
Affected fuel type area
This plot displays the area of fuel types affected per simulation step. This is calculated by intersecting the fuel map used for the simulation with the simulation perimeter at each timestep. The two icons above the plot toggle the display of the Land Cover layer on the map and open the Layers tab, respectively.
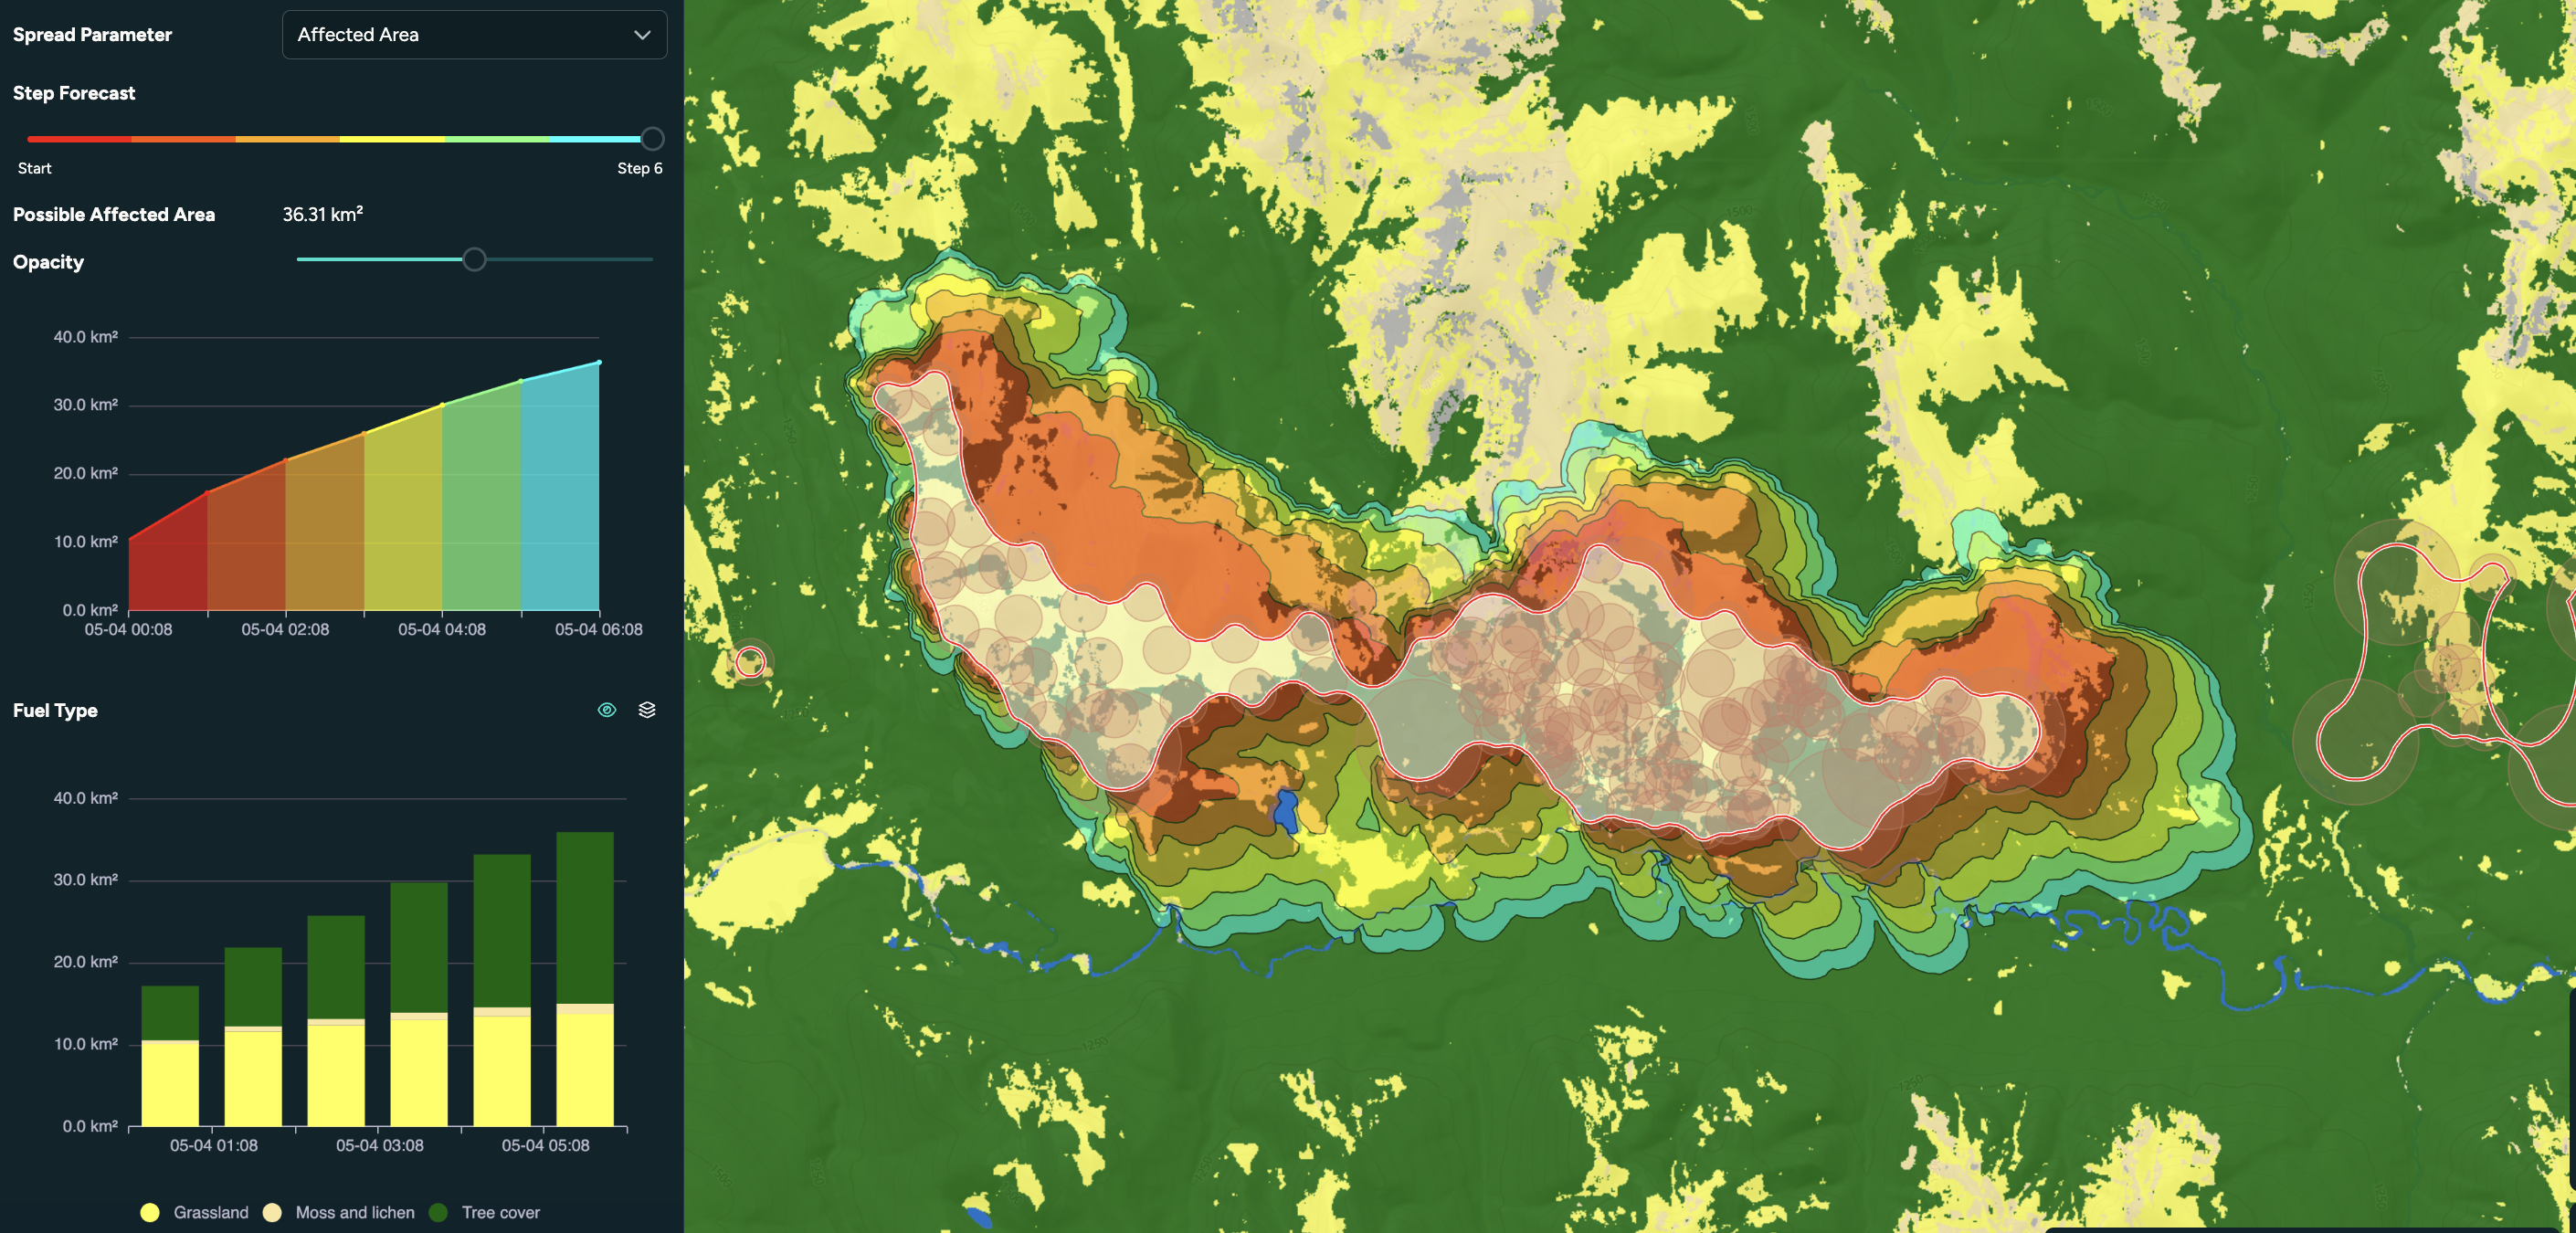
There can be small differences in area between the total affected area and affected fuel type area charts. This is because we filter out nonburnable fuels from the calculation to avoid noise. Trace amounts of nonburnable fuels might be 'affected' by the simulated fire due to differences in resolution between the simulator and the fuel map.
Fireline intensity
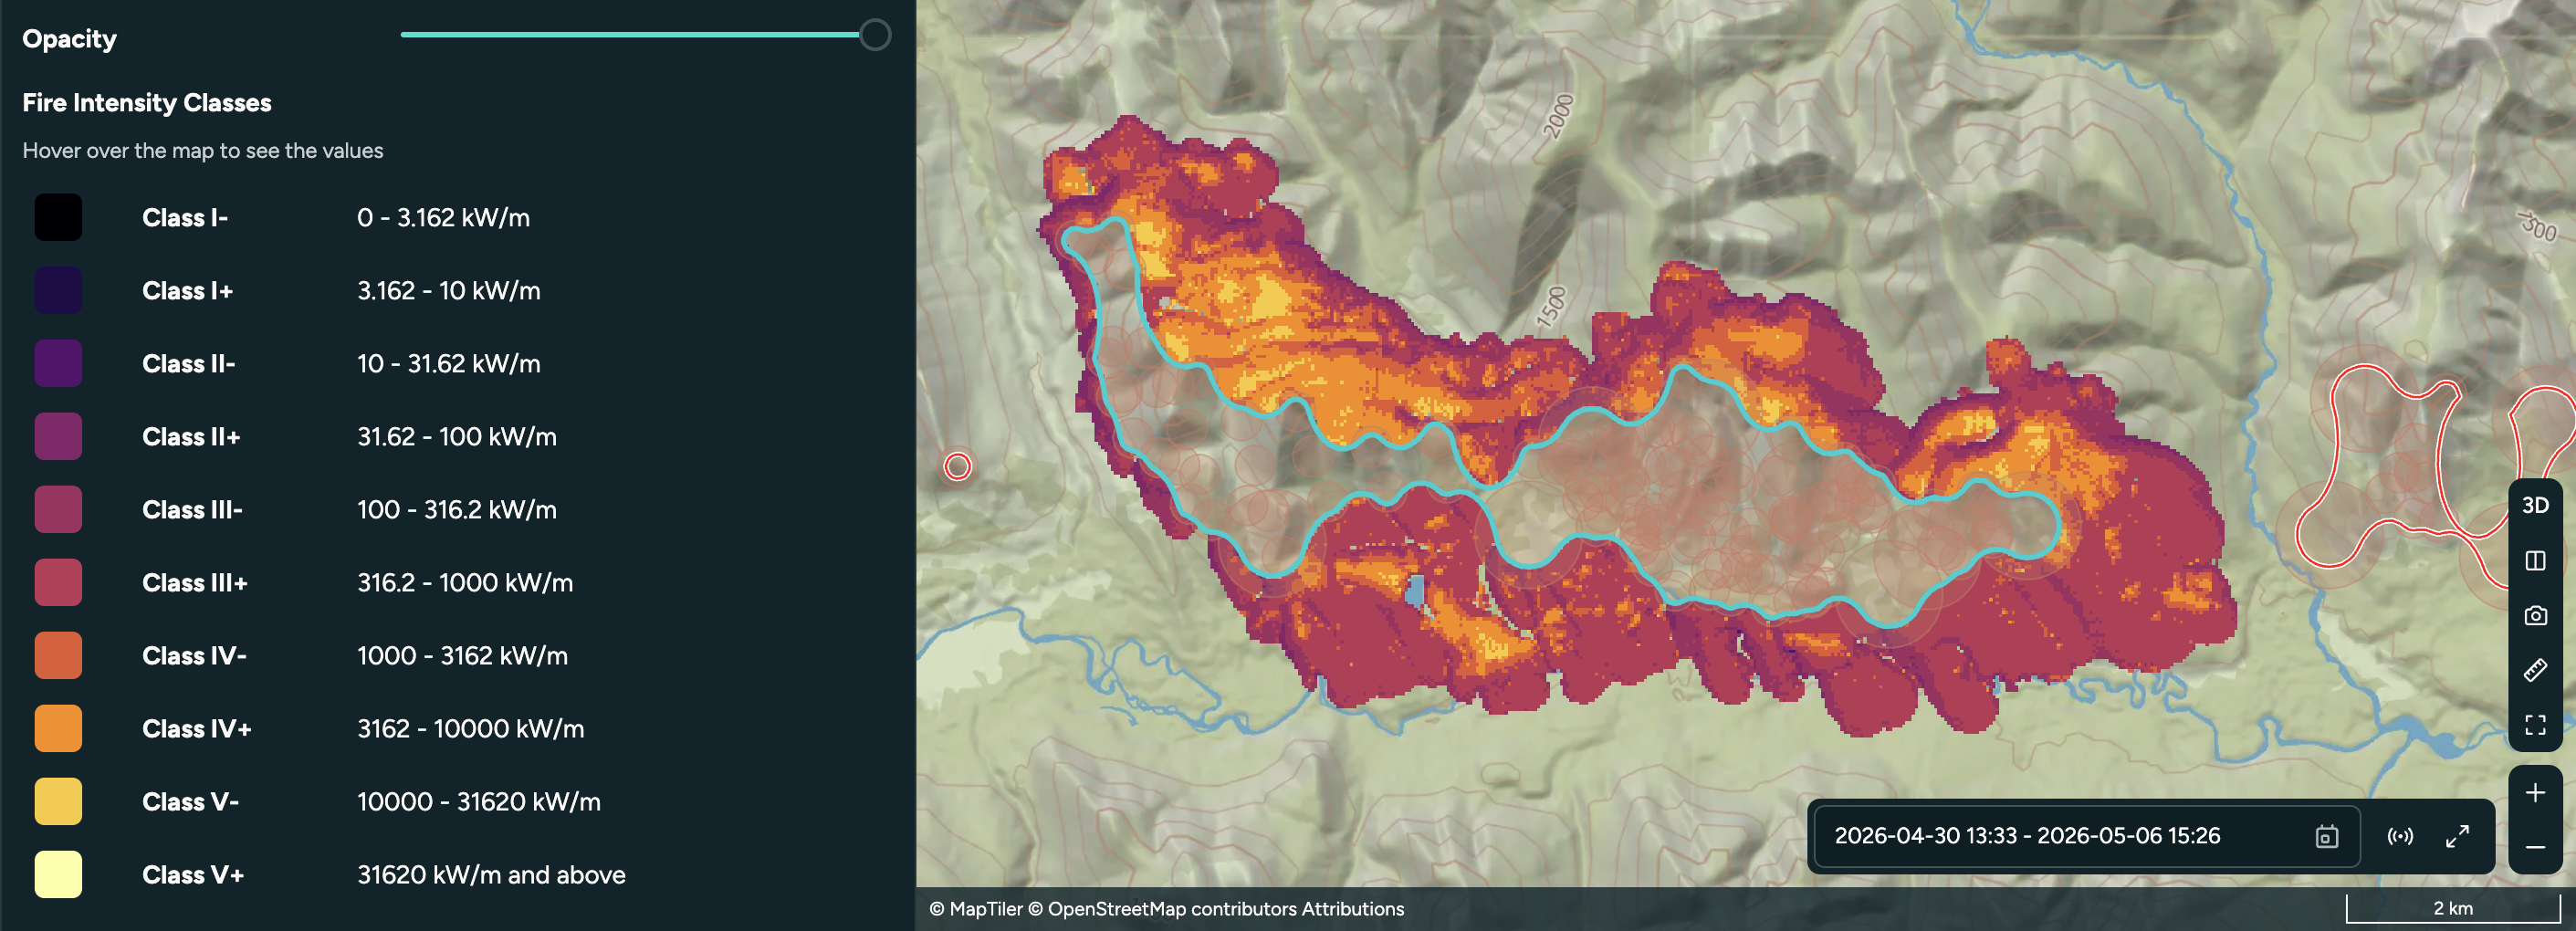
Byram fireline intensity (BFI), or simply fireline intensity, is a measure of the rate of heat released per unit length of the fire front, expressed in kilowatts per meter (kW/m). This metric is crucial for understanding wildfire behavior, assessing fire effects, planning prescribed burns, and supporting fire suppression efforts.
Flame length
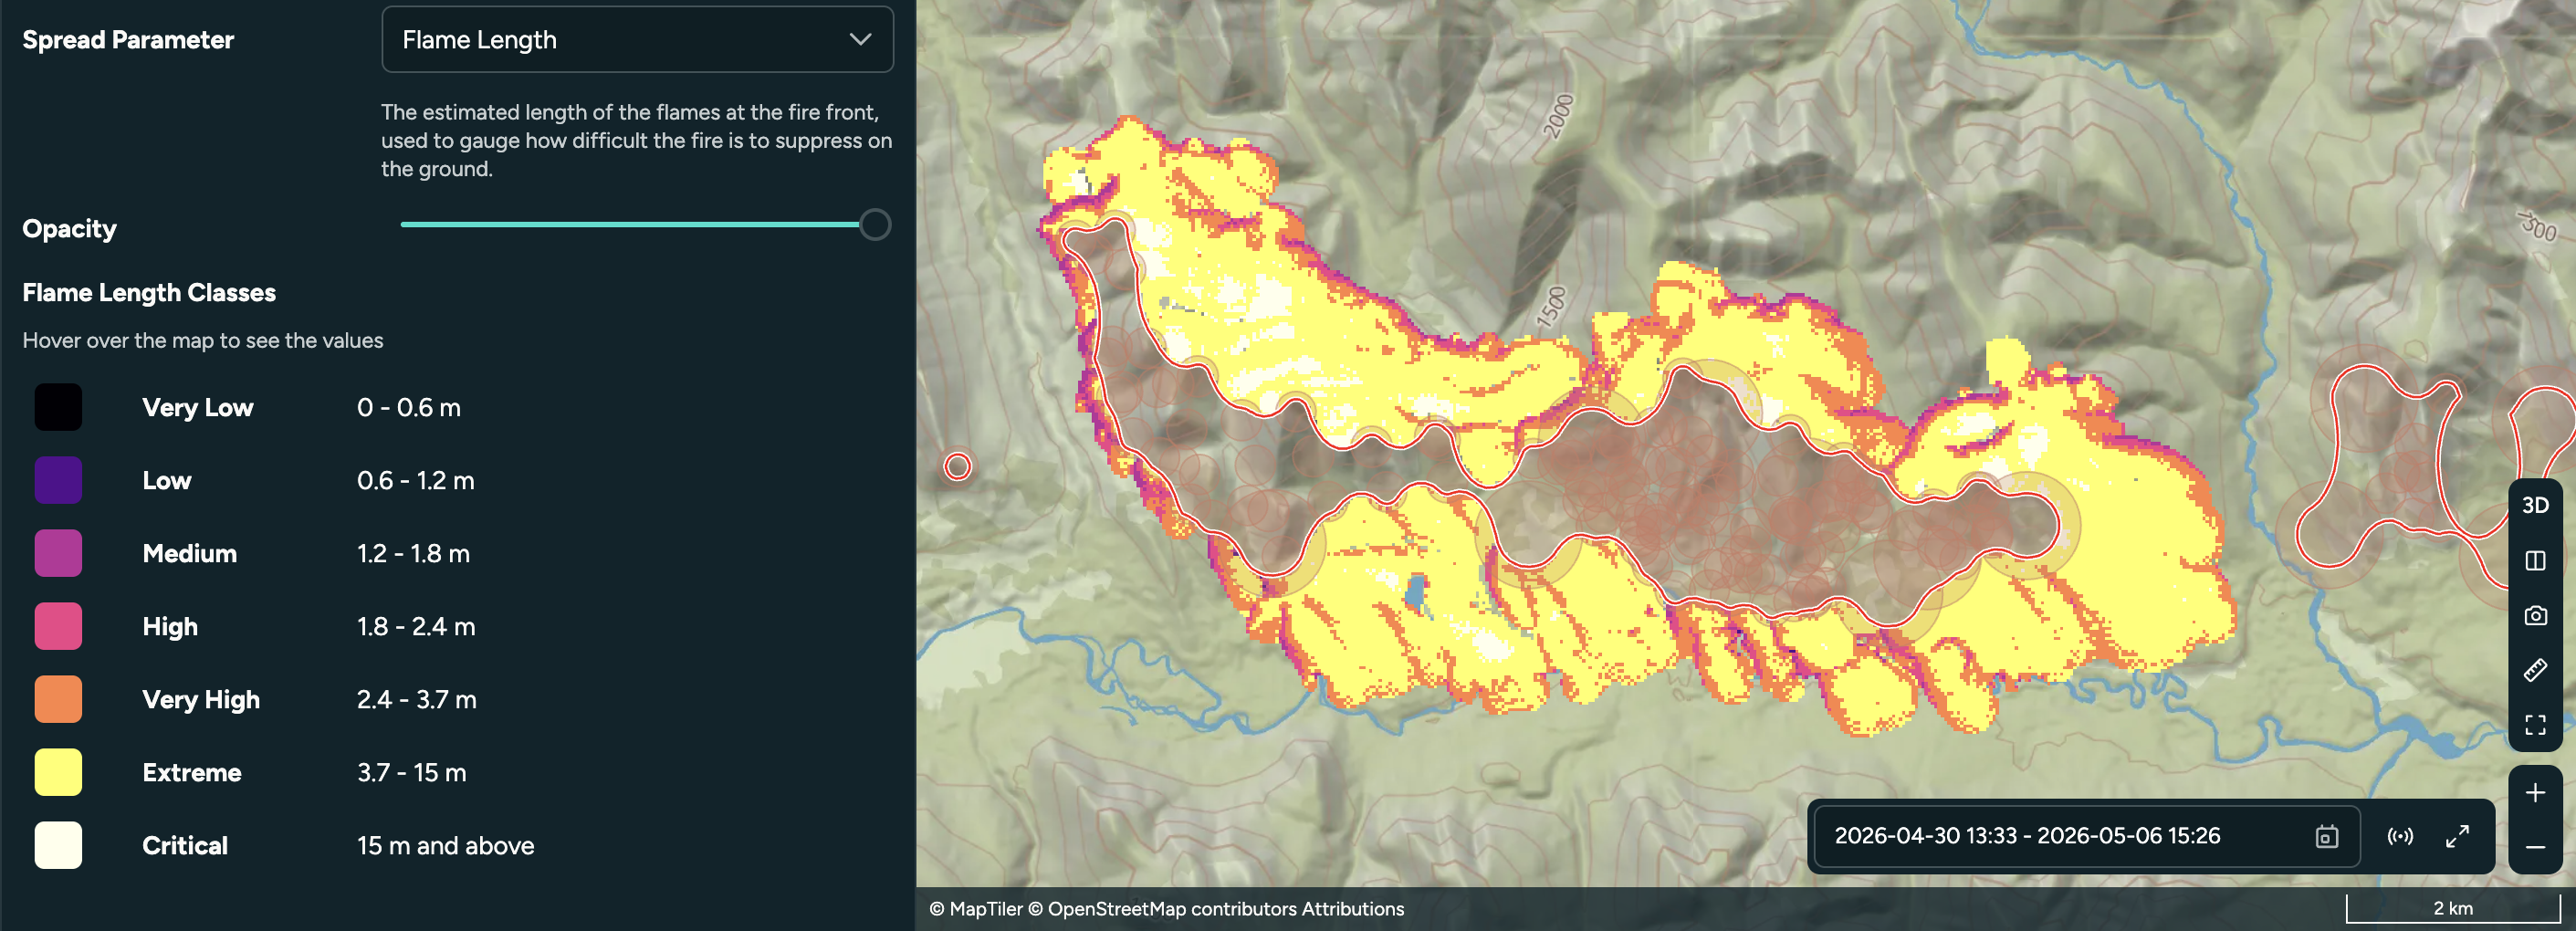
The predicted length of flames at the fire front, measured in meters, serves as a critical indicator of the fire's intensity and the challenges it poses for ground-based suppression efforts.
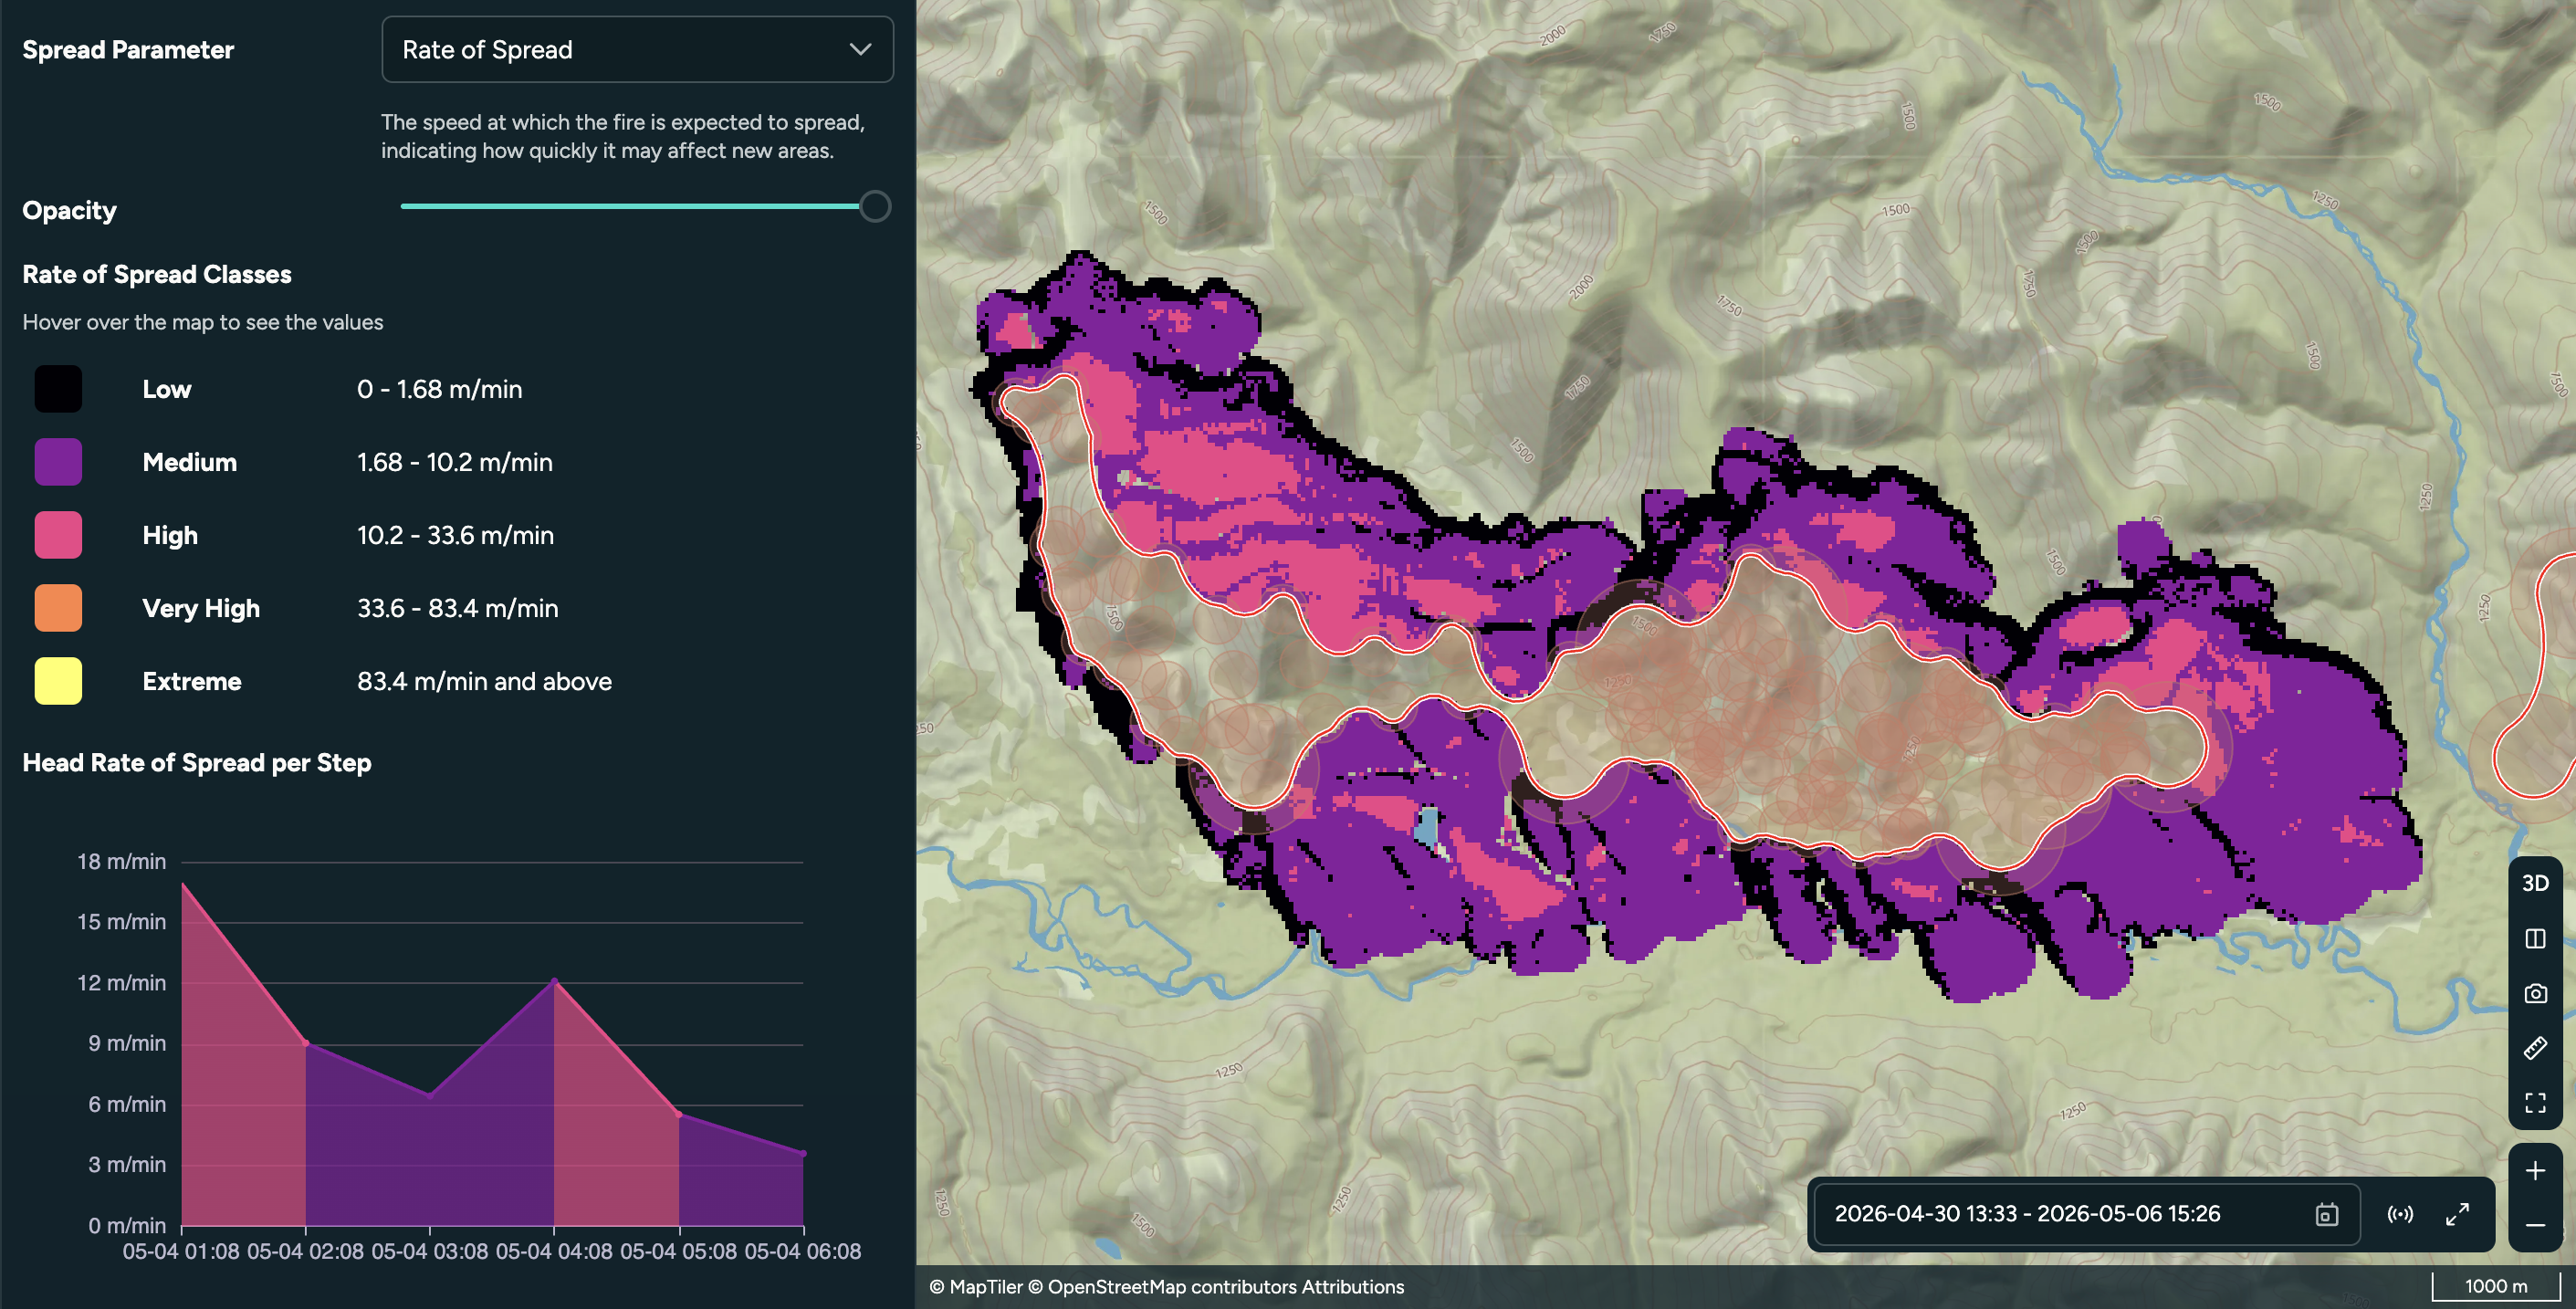
Rate of Spread
The rate of spread represents the velocity at which the fire advances, measured in meters per minute. This metric is essential for predicting how quickly the fire may reach new areas, aiding in resource allocation and strategic planning for fire suppression.
The Head Rate of Spread (HROS) per Step represents the maximum Rate of Spread at each timestep, or the speed at which the fastest-moving portion (the "head") of the fire moves. As ROS, it is measured in m/min.